
Monitoring & Jobs
Synclet provides built-in tools for monitoring your data syncs — a real-time dashboard, detailed job history, per-connector logs, and Prometheus-compatible metrics for external observability.
Dashboard
Section titled “Dashboard”The dashboard is the landing page after you log in. It provides a high-level view of your workspace’s sync health.
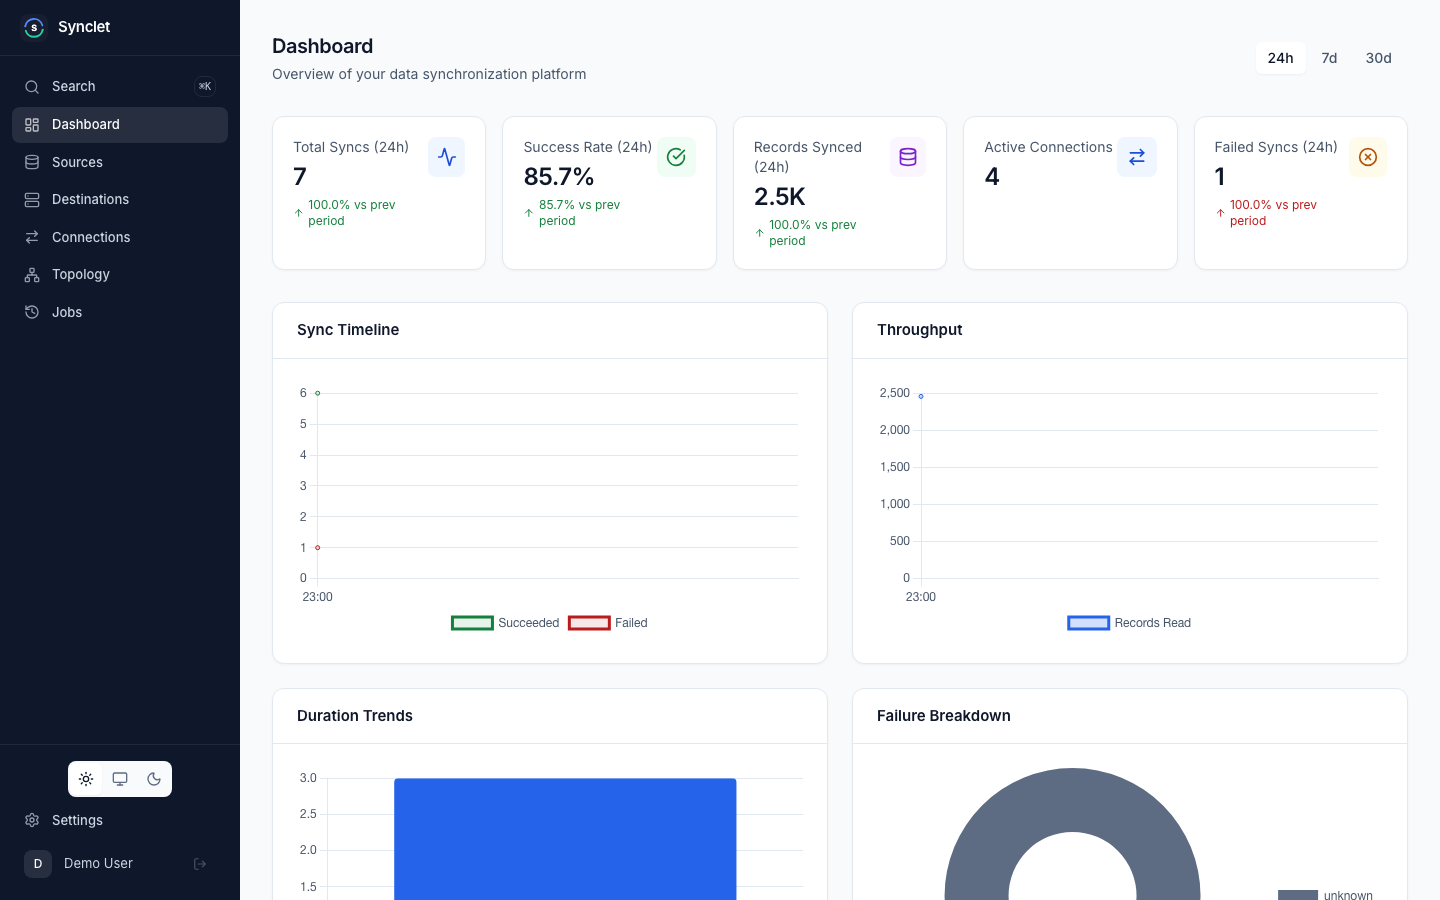
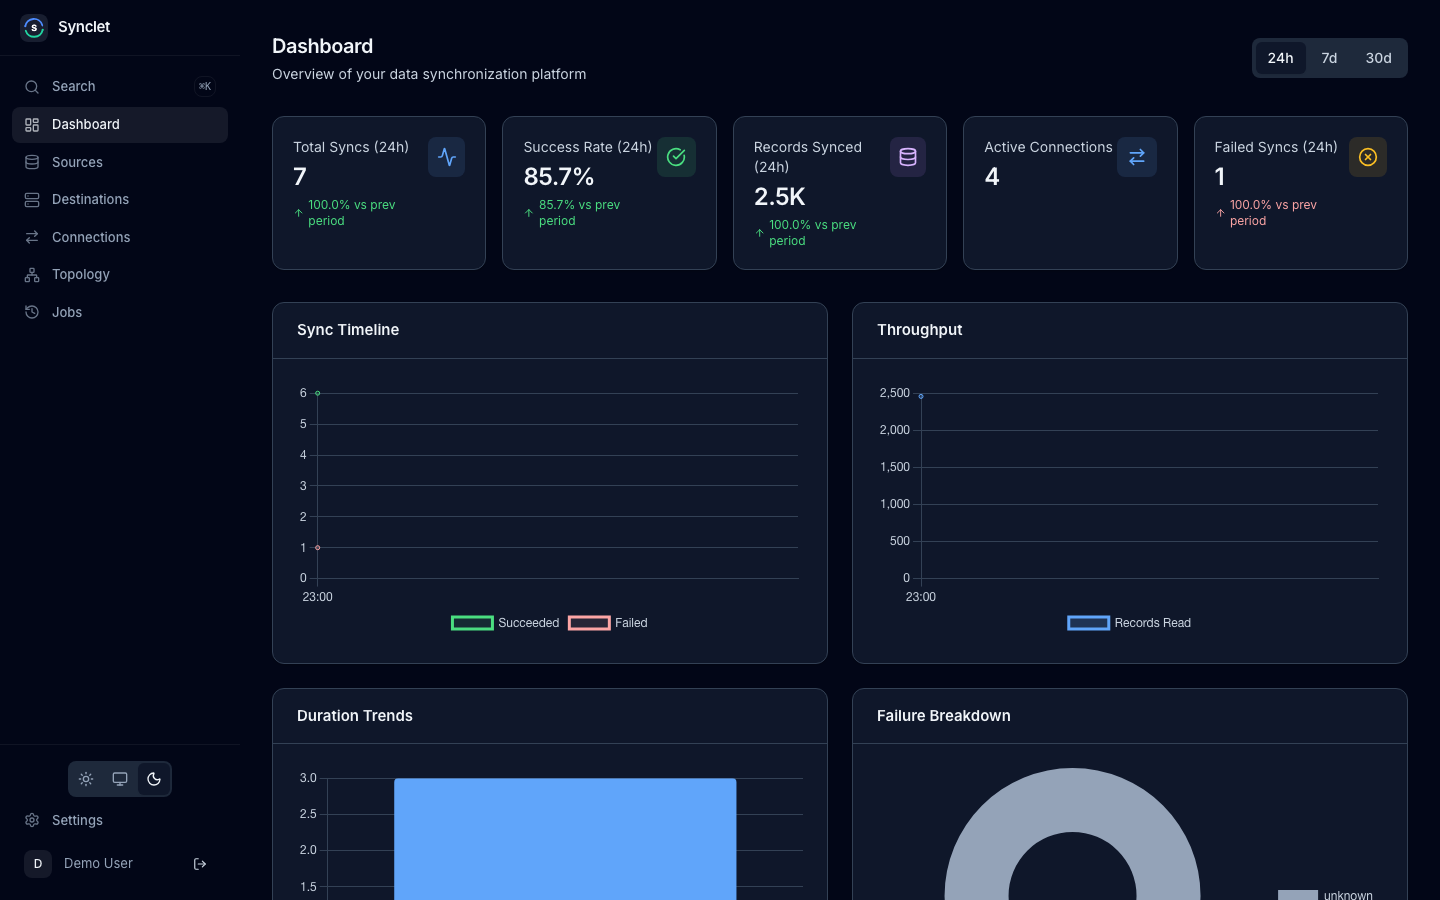
The 24h / 7d / 30d selector in the top right sets the time range of the stat cards and charts; 24h is the default.
Stat Cards
Section titled “Stat Cards”| Card | What it counts |
|---|---|
| Total Syncs | Syncs that ran in the selected range. |
| Success Rate | Share of those syncs that succeeded. |
| Records Synced | Records read from sources in the range. |
| Active Connections | Connections whose status is active, whatever the range. |
| Failed Syncs | Syncs that failed in the range. |
Every card but Active Connections carries its range in the label, for example Total Syncs (24h), and a trend line that compares it with the range before (the previous 24 hours, 7 days or 30 days): a percentage change, and for Success Rate the change in percentage points. Green means better and red worse, so for Failed Syncs a rise is red.
Charts
Section titled “Charts”| Chart | What it shows |
|---|---|
| Sync Timeline | Succeeded and failed syncs per hour (24h) or per day (7d, 30d). |
| Throughput | Records read per hour or per day. |
| Duration Trends | Average sync duration per hour or per day. |
| Failure Breakdown | The range’s failed jobs by cause: connector, timeout, oom, infrastructure or unknown, read from the error message. |
Top Connections lists the five connections with the most records synced in the range, with their records, bytes, last sync and a trend sparkline.
Connection Health
Section titled “Connection Health”The Connection Health grid has one tile per connection, linked to the connection’s page, with one of these labels:
| Health | Meaning |
|---|---|
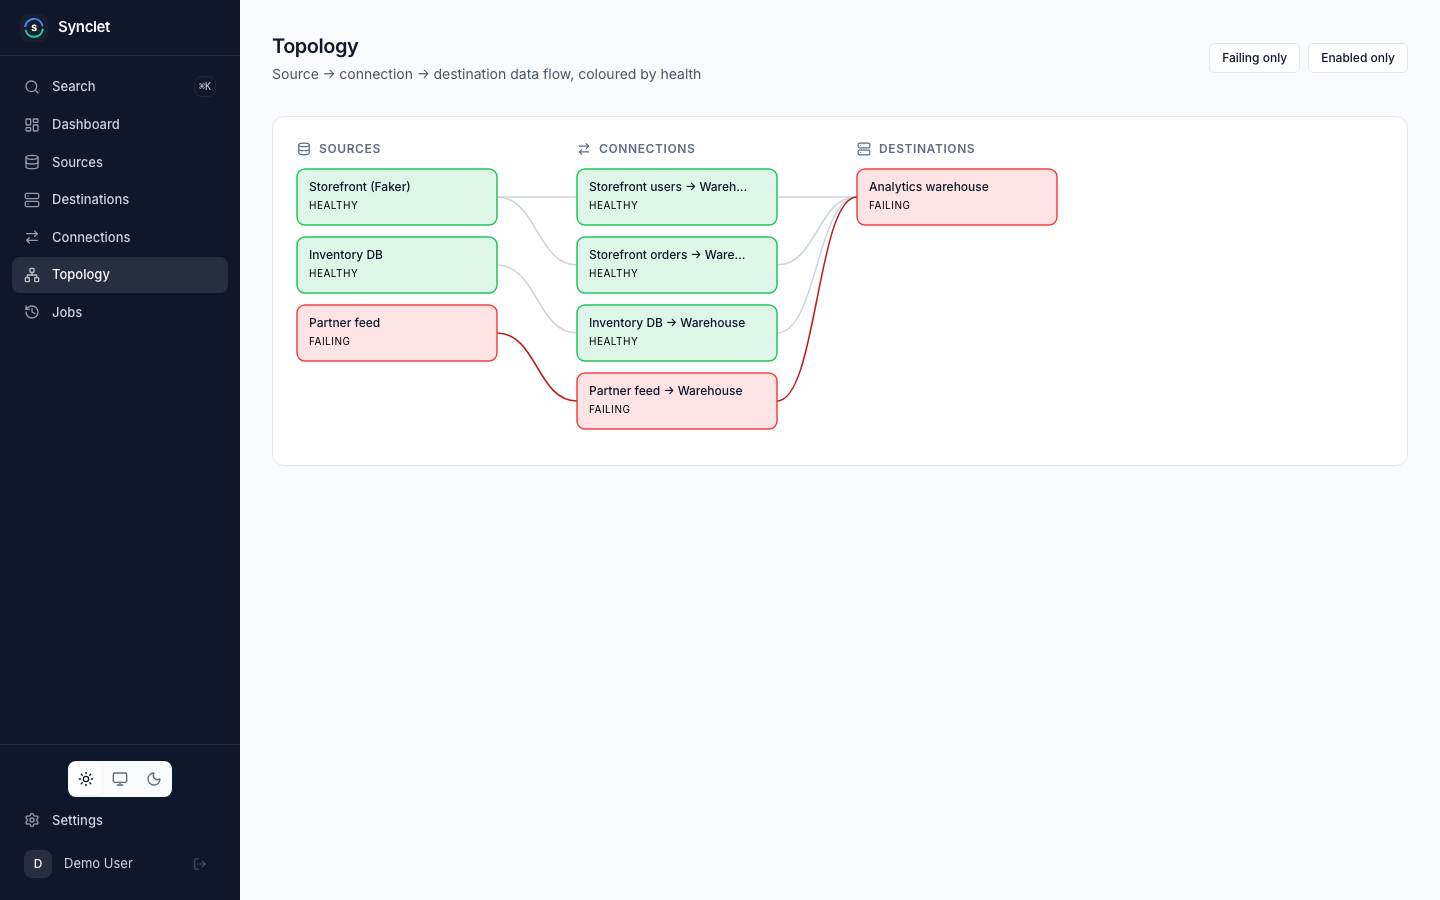
| Healthy | The last sync did not fail and the next one is not overdue, or the connection has not synced yet. A connection without a schedule is never overdue. |
| Warning | More than twice the schedule’s interval has passed since the last sync, or the schedule cannot be parsed. |
| Failing | The last sync failed, or more than three times the schedule’s interval has passed since the last sync. |
| Disabled | The connection is not active (inactive or paused), so no syncs are scheduled. |
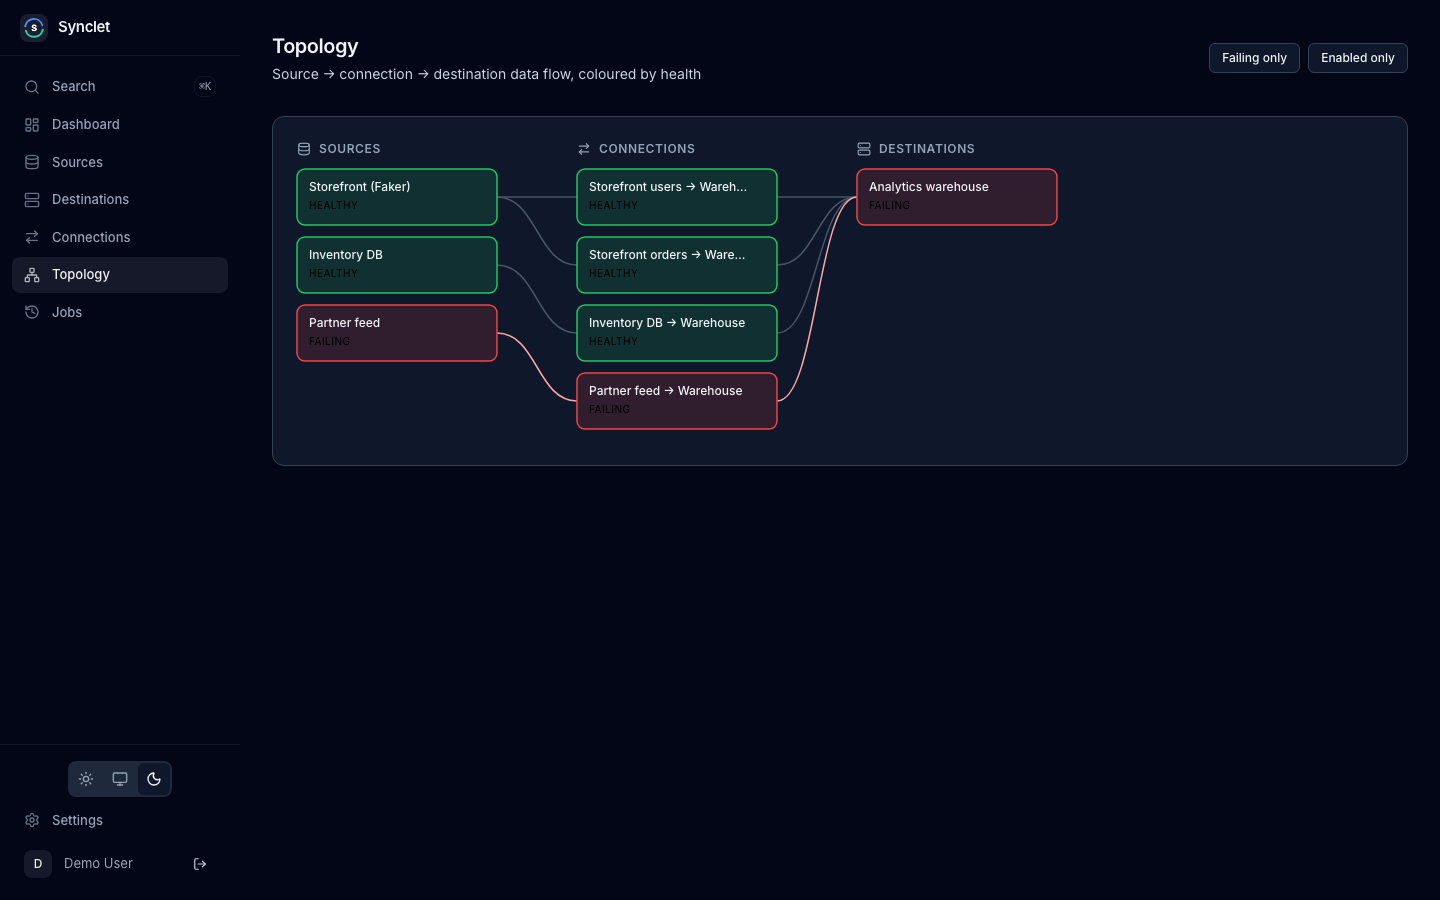
The Topology page draws every source, connection and destination as one graph, coloured by health, with filters for failing and enabled connections only.
Job History
Section titled “Job History”Every sync run creates a job. You can browse all jobs from the Jobs page in the sidebar.
Job States
Section titled “Job States”| State | Description |
|---|---|
| Scheduled | The job is enqueued and waiting for a worker. |
| Starting | The job is initializing (pulling connector image, preparing workspace). |
| Running | The job is actively syncing data. |
| Completed | The job completed successfully. |
| Failed | The job failed after exhausting all retry attempts. |
| Cancelled | The job was manually cancelled by a user. |
Filtering
Section titled “Filtering”You can filter the job list by:
- Connection — Show jobs for a specific connection.
- Status — Show only active (scheduled, starting or running), completed, failed, or cancelled jobs.
Click any job to view its details.
Job Detail
Section titled “Job Detail”The job detail page shows everything about a specific sync run.
Summary
Section titled “Summary”The cards at the top show the job’s Status, its Total duration, Records (latest) (records read by the latest attempt, with Filtered out when transforms dropped records) and Attempt as the current attempt out of the connection’s maximum, for example 2 / 3. A failed job shows its error in a red banner below the cards.
Timeline and Attempts
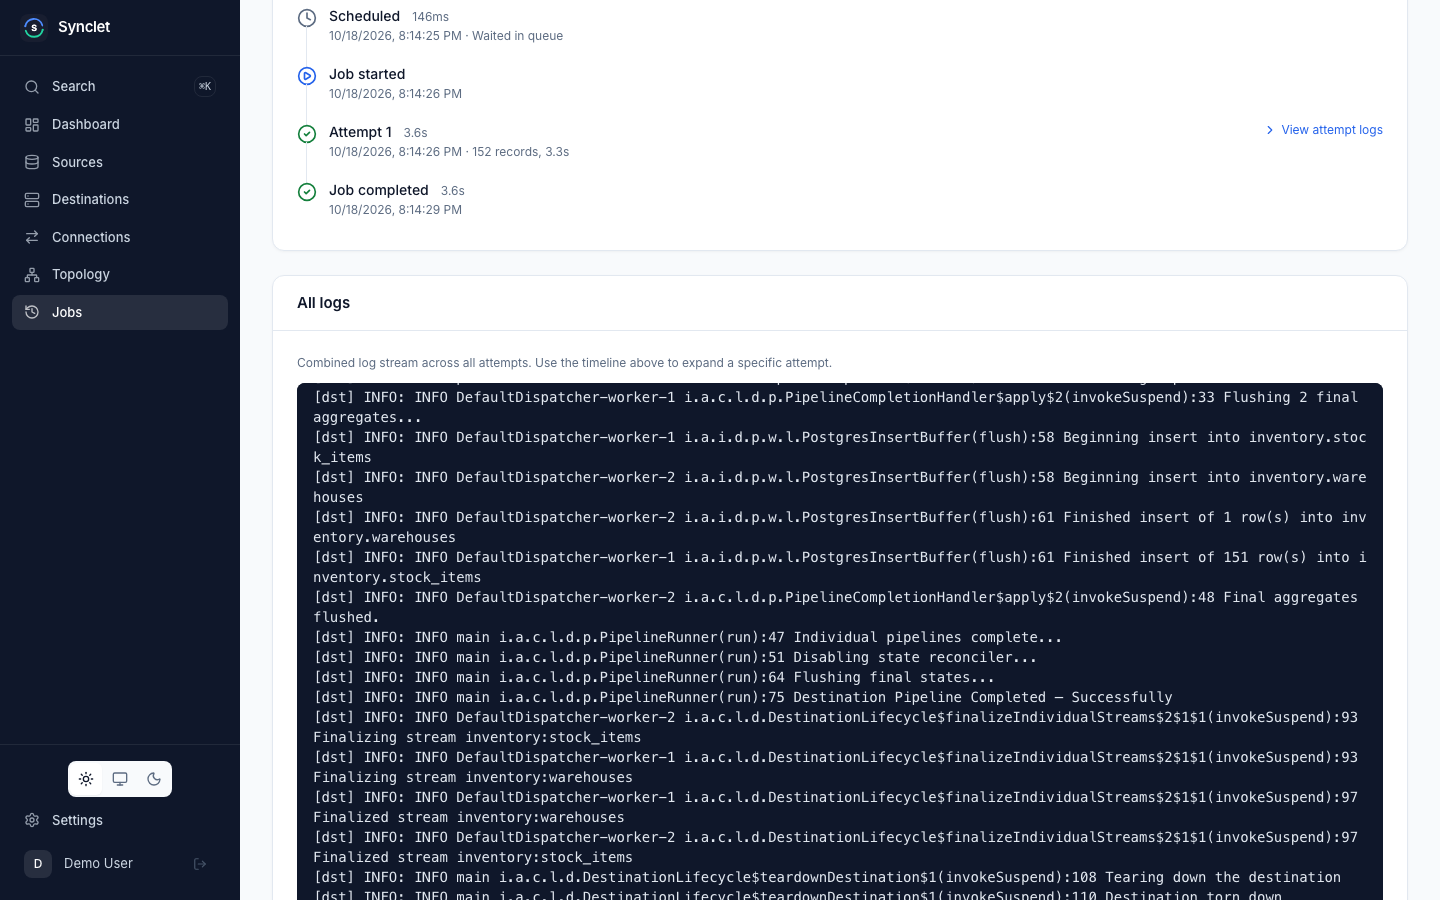
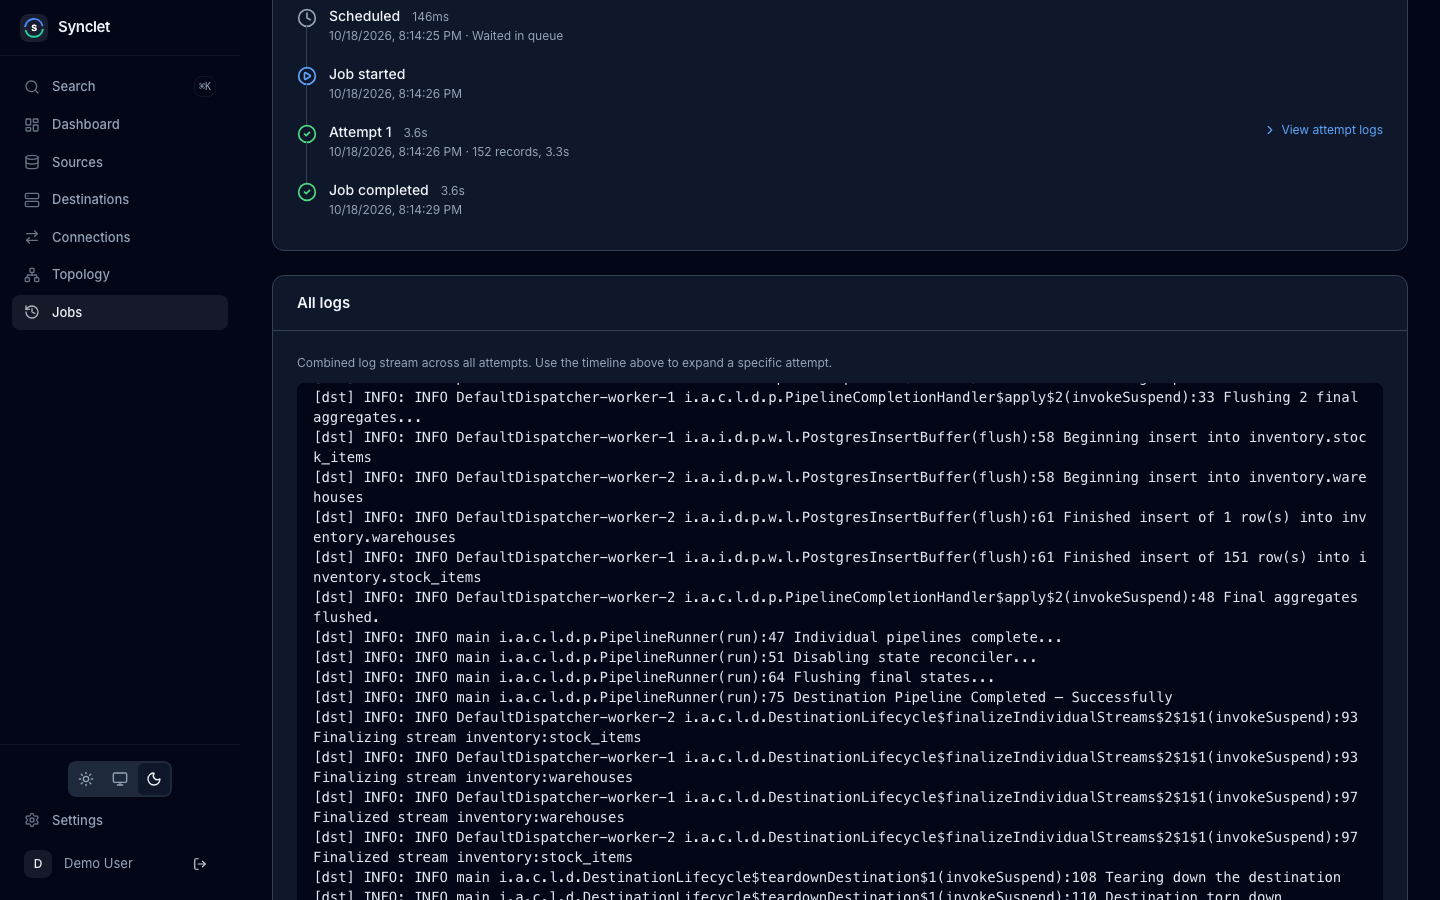
Section titled “Timeline and Attempts”The Timeline card lists the job’s steps in order: Scheduled (with the time spent waiting in the queue), Job started, one Attempt N entry per attempt, and Job completed, Job failed or Job cancelled. Each attempt shows when it started and how long it ran, and then either its error or the records it read and its duration.
A job gets a new attempt when an attempt fails and the connection’s retry policy allows another; see Scheduling & Triggers. The job fails only when its last attempt fails.
Synclet stores the log lines of the source and destination connectors for every attempt. While the job runs, the job page polls for new lines and appends them.
Reading Logs
Section titled “Reading Logs”- All logs shows the combined log of every attempt in the order the lines were written.
- View attempt logs on an attempt in the timeline opens the log inline under that attempt.
- Download logs on an attempt saves the full log of that attempt, and only that attempt, as a plain-text file named
job-<job-id>-attempt-<n>.log. The download includes lines that are already in the log archive.
The browser collects a download in memory and stops at 200 MB. For a larger attempt log, enable a log archive backend and read the attempt’s object from the archive directly.
Log Lines
Section titled “Log Lines”Each line names the connector it came from and the level or type of the message:
[src] INFO: Starting sync of stream users[dst] WARN: Column "legacy_id" is deprecated[src] ERROR: Connection refused[src] TRACE: ESTIMATE| Prefix | Meaning |
|---|---|
[src] | Message from the source connector. |
[dst] | Message from the destination connector. |
[synclet] | Line written by Synclet: the truncation line described under Dropped Lines. |
After the prefix comes the level of an Airbyte LOG message as the connector sent it: FATAL, ERROR, WARN, INFO, DEBUG or TRACE. Airbyte TRACE messages are logged too: error traces as ERROR: <message>, analytics traces as TRACE: <type> = <value>, and the source’s estimate traces as TRACE: ESTIMATE. Stream status traces are not logged. Synclet stores every level the connector emits; the UI does not filter by level, so search the downloaded file to focus on warnings and errors.
Dropped Lines
Section titled “Dropped Lines”Each attempt keeps at most PIPELINE_LOG_MAX_LINES_PER_ATTEMPT lines (100,000 by default; 0 keeps every line). Lines past the cap are dropped and counted in a single line at the end of the attempt’s log, updated as more lines are dropped:
[synclet] log truncated: 25000 further lines droppedThe job page reports the count too: the timeline shows N lines dropped next to each attempt that hit the cap, and All logs shows the total for the job. Dropped lines are also counted in the synclet_log_lines_dropped_total metric.
Log storage and archiving
Section titled “Log storage and archiving”While a job runs, its log lines are stored in PostgreSQL and the UI tails them from there.
PIPELINE_LOG_ARCHIVE_BACKEND decides where the logs of finished jobs go:
| Backend | Where logs of finished jobs live |
|---|---|
none (default) | They stay in PostgreSQL until job retention deletes the job. |
filesystem | Files under PIPELINE_LOG_ARCHIVE_DIR. Every server replica must see the same directory, so use a shared volume. |
s3 | Any S3-compatible bucket: AWS S3, MinIO, Cloudflare R2, Google Cloud Storage through its S3 interoperability endpoint (HMAC keys), or the Garage store bundled with the Helm chart. Set PIPELINE_LOG_ARCHIVE_S3_ENDPOINT for anything but AWS, and PIPELINE_LOG_ARCHIVE_S3_USE_PATH_STYLE=true for MinIO. Without static keys the default AWS credential chain is used (environment, IRSA, instance profile). |
gcs | Google Cloud Storage through its native API. With PIPELINE_LOG_ARCHIVE_GCS_CREDENTIALS_FILE it uses that service account key; without it, Application Default Credentials (GKE Workload Identity, GOOGLE_APPLICATION_CREDENTIALS, or gcloud auth application-default login locally). |
With an archive backend, a finished job’s logs move out of PostgreSQL into one gzipped NDJSON object per attempt, keyed logs/<workspace>/<connection>/<job>/<attempt>.ndjson.gz, and the UI reads them back from there. Job retention and workspace deletion remove the objects too.
The server logs which GCS credential source it uses at startup. Credentials are resolved on first use, so missing credentials show up as archive errors and in synclet_log_archive_failures_total, not as a startup failure.
Switching back to none leaves already archived logs where they are, but they can no longer be read from the UI.
All variables are listed under Environment Variables: Job Logs.
Prometheus Metrics
Section titled “Prometheus Metrics”Synclet exposes a Prometheus-compatible metrics endpoint for integration with external monitoring systems like Grafana.
Metrics Endpoint
Section titled “Metrics Endpoint”GET /metricsThe endpoint is served on the internal port (INTERNAL_HTTP_SERVER_ADDR, 8081 by default), not on the public UI port, and returns metrics in the Prometheus exposition format.
curl -s http://localhost:8081/metricsKey Metrics
Section titled “Key Metrics”| Metric | Type | Description |
|---|---|---|
synclet_syncs_total | Counter | Total number of syncs by workspace, connection, and status. |
synclet_sync_duration_seconds | Histogram | Duration of sync operations in seconds. |
synclet_records_synced_total | Counter | Total records synced by workspace, connection, and direction. |
synclet_bytes_synced_total | Counter | Total bytes synced by workspace and connection. |
synclet_active_syncs | Gauge | Number of currently running syncs. |
synclet_failed_syncs_total | Counter | Total number of failed syncs by workspace and connection. |
synclet_zero_record_syncs_total | Counter | Total number of completed syncs that read zero records, by workspace and connection. Counted by the Docker executor. |
synclet_pending_jobs | Gauge | Number of pending jobs in the queue. |
synclet_connector_sync_duration_seconds | Histogram | Duration of sync operations by connector type. |
synclet_log_archive_failures_total | Counter | Job attempts whose logs failed to archive, by archive backend (filesystem, s3, gcs). |
synclet_log_archive_bytes_total | Counter | Total size in bytes of the job log objects written to the log archive. |
synclet_log_lines_dropped_total | Counter | Job log lines dropped by the per-attempt line cap (PIPELINE_LOG_MAX_LINES_PER_ATTEMPT). |
Kubernetes ServiceMonitor
Section titled “Kubernetes ServiceMonitor”With the Prometheus Operator, let the Helm chart create the ServiceMonitor instead of writing one by hand. server.serviceMonitor.enabled scrapes /metrics on the internal Service port, and labels go on the ServiceMonitor so your Prometheus selects it:
server: serviceMonitor: enabled: true interval: 30s labels: release: prometheus # match your Prometheus selectorIn distributed mode the executor pods serve their own metrics. executor.serviceMonitor.enabled adds a metrics Service and a ServiceMonitor for them, with the same keys (interval, scrapeTimeout, path, port, labels, annotations):
executor: serviceMonitor: enabled: true labels: release: prometheusHealth Endpoints
Section titled “Health Endpoints”Synclet serves two probes on the internal port (8081 by default):
| Endpoint | Returns 200 when |
|---|---|
GET /live | The process answers HTTP. |
GET /ready | Every health check passes: the database answers, background jobs have started and the event router is running (the last two only in processes that run them). Otherwise 503, with the failing checks in the JSON body. |
curl -s http://localhost:8081/readyPoint load balancer health checks and Kubernetes probes at these endpoints. Images up to 0.4.0 serve only GET /health on the public port.
Next Steps
Section titled “Next Steps”- Scheduling & Triggers — Configure when syncs run and how retries work.
- Notifications — Get alerted when syncs fail.
- Environment Variables — Configure metrics, log storage, and health check settings.
Airbyte is a trademark of Airbyte, Inc. Synclet is not affiliated with, endorsed by or sponsored by Airbyte, Inc. Connector images keep their own licenses: see Connector licenses.